
— Personal Injury Law
South Jersey Traffic Deaths: 5 Years of Crash Data for Burlington, Camden and Gloucester Counties
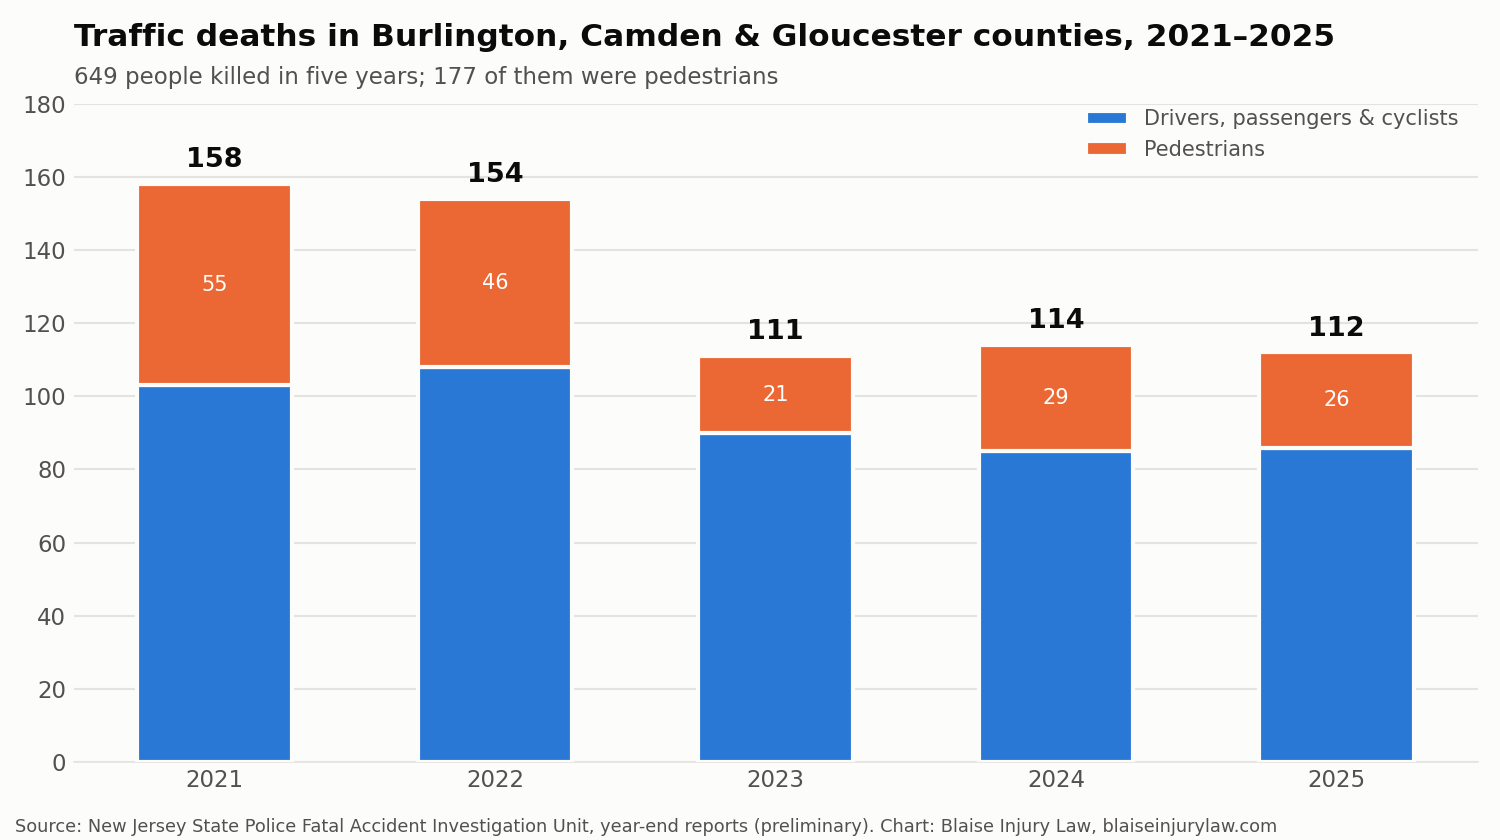
Get a Free ConsultationBetween 2021 and 2025, 649 people were killed in traffic crashes in Burlington, Camden and Gloucester counties, according to year-end figures from the New Jersey State Police. Deaths have fallen since the 2021–2022 peak, but they have held at roughly 110 a year since 2023. And in Camden County, more than 4 in 10 people killed on the road were pedestrians.
We pulled five years of official fatality data for the three South Jersey counties we serve, plus 2026 numbers to date, to show where and how people are dying on local roads.
Key findings
- 649 traffic deaths in five years across Burlington, Camden and Gloucester counties (2021–2025).
- 177 of those killed were pedestrians, about 27% of all deaths.
- Camden County lost 100 pedestrians in five years, 41.5% of its 241 traffic deaths, well above the statewide share of roughly 30%.
- Deaths dropped 29% from 2021 to 2025 (158 to 112), but progress has stalled: 111 in 2023, 114 in 2024 and 112 in 2025.
- 2026 so far: 67 people killed in the three counties through September 18, including 16 pedestrians. Twelve of those pedestrians were killed in Camden County.
Traffic deaths by county and year
Total people killed in traffic crashes, with pedestrians killed in parentheses.
| Year | Burlington | Camden | Gloucester | Three-county total | New Jersey total |
|---|---|---|---|---|---|
| 2021 | 41 (11) | 69 (35) | 48 (9) | 158 (55) | 697 |
| 2022 | 60 (13) | 54 (26) | 40 (7) | 154 (46) | 689 |
| 2023 | 36 (5) | 41 (11) | 34 (5) | 111 (21) | 606 |
| 2024 | 45 (9) | 37 (14) | 32 (6) | 114 (29) | 684 |
| 2025 | 43 (9) | 40 (14) | 29 (3) | 112 (26) | 583 |
| 2021–2025 | 225 (47) | 241 (100) | 183 (30) | 649 (177) | 3,259 |
| 2026 (through Sept. 18) | 25 (2) | 22 (12) | 20 (2) | 67 (16) | 375 |
Figures are the New Jersey State Police’s year-end preliminary counts and may be revised. Totals for 2021–2025 and the three-county columns are our sums of the county figures.
County by county
Camden County: a pedestrian safety problem
Camden County recorded 241 traffic deaths from 2021 to 2025, the most of the three counties. What sets it apart is who is dying: 100 of those killed were pedestrians. In 2021 alone, 35 pedestrians were killed, more than half of the county’s 69 traffic deaths. The pattern is continuing in 2026, with 12 of Camden County’s 22 deaths through mid-September involving people on foot. Dense corridors, busy commercial roads and highways cutting through neighborhoods all put walkers at risk.
Burlington County: more deaths on the roads in 2026
Burlington County had 225 traffic deaths over the five years, peaking at 60 in 2022. Most victims were drivers and passengers, reflecting the county’s long stretches of highway, including the New Jersey Turnpike, I-295 and Routes 38, 70 and 130. Through September 18, 2026, Burlington has recorded 25 deaths, the most of the three counties so far this year.
Gloucester County: steady decline
Gloucester County’s traffic deaths fell every year in the period, from 48 in 2021 to 29 in 2025, a drop of about 40%. Pedestrian deaths fell to three in 2025. Even so, Gloucester still recorded 183 deaths over five years, many on high-speed roads such as Route 55 and Route 42.
The most dangerous highway stretches in South Jersey
A September 2026 Philadelphia Inquirer analysis of NJDOT crash data counted about 330 fatal crashes on South Jersey’s limited-access highways from 2019 through July 2026, with more than 360 people killed. The segments it identified in our three counties include:
- I-76 in Camden County: a 1.3-mile stretch with 10 fatal crashes, more deaths than any other highway segment in the region.
- I-676 in Camden County: a 0.6-mile stretch approaching the Ben Franklin Bridge, with 4 fatal crashes.
- New Jersey Turnpike in Mount Laurel, Burlington County: a half-mile stretch with 4 fatal crashes.
- Route 55 in Elk Township, Gloucester County: a 0.64-mile segment with 4 fatal crashes.
The same analysis found that distracted driving played a role in nearly half of South Jersey’s fatal crashes, contributing to more than 140 deaths, and that alcohol was a factor in more than 75 fatal crashes.
What these numbers mean for drivers and pedestrians
- Put the phone away. Distraction is the single biggest factor in local fatal crashes. New Jersey law bans handheld phone use while driving.
- Be extra alert at night and on busy commercial roads. Pedestrians are hardest to see after dark, and multi-lane roads with frequent driveways and crossings are where many are struck.
- Slow down on short highway segments with merges and exits, like the I-76 and I-676 approaches to Philadelphia, where traffic changes speed quickly.
- If you walk, cross at marked crosswalks and wear something visible at night. New Jersey requires drivers to stop for pedestrians in marked crosswalks.
If you or a loved one was hurt in a crash
Behind every number above is a family dealing with loss or serious injury. If you were hurt in a car accident, struck as a pedestrian or injured in a motorcycle crash in South Jersey, it’s worth understanding your rights early. New Jersey generally gives injured people two years to file a lawsuit, so timing matters. You can contact Blaise Injury Law for a free consultation.
Methodology and sources
Fatality counts come from the New Jersey State Police Fatal Accident Investigation Unit’s “Victim Classification by County” reports as of December 31 of each year (2021, 2022, 2023, 2024, 2025) and the 2026 year-to-date report as of September 18, 2026. The State Police describe these figures as preliminary and subject to change. “Pedestrians” are people killed while on foot; “drivers, passengers and cyclists” combines the report’s driver, passenger and pedalcyclist categories. Highway segment data comes from the Philadelphia Inquirer’s analysis of New Jersey Department of Transportation crash records, linked above.
For journalists and researchers: You’re welcome to use the chart and figures on this page. Please credit Blaise Injury Law and link to this page.
— Free Case Evaluation
Ready to Discuss Your Case?
Our attorneys offer free consultations — no fees unless we win your case.
Get a Free Consultation(856) 340-5685